Appearance
Analysis update
The Analysis update page consists of the following sections (or “panels”):
- Sale information
- Admin and flags
- Improvements
- Development applications
- Paired sales
- Sale adjustments
- Commercial lease
- Commercial / industrial replacement cost
- Rural analysis
- Rural land classification
- Calculations
- Sale summary
- Internal notes
- Multi-property PIDs or dealings
- Attachments
- Attachment folders
- Map
- Benchmarks
These panels can be expanded, collapsed, and arranged on one or more tabs. You can save tab layouts, and instantly switch between multiple tab layouts.
The panel ordering is associated with your user, so even if you log on from a different computer, the panel ordering will be as you have set it elsewhere.
If you make changes to any of the fields or values and try to load a different page in the current tab without saving, the browser will ask you if this is what you really want to do. The same applies if you try to close the tab or the browser window without saving.
There is a Save button at the top of the page. You can press it to save whenever you make changes to the analysis.
If the property has tags that are marked as Flag on analyses, a popup will appear when you open the analysis update page. This popup will show you the list of marked tags on the property as a reminder to mention them in the analysis.
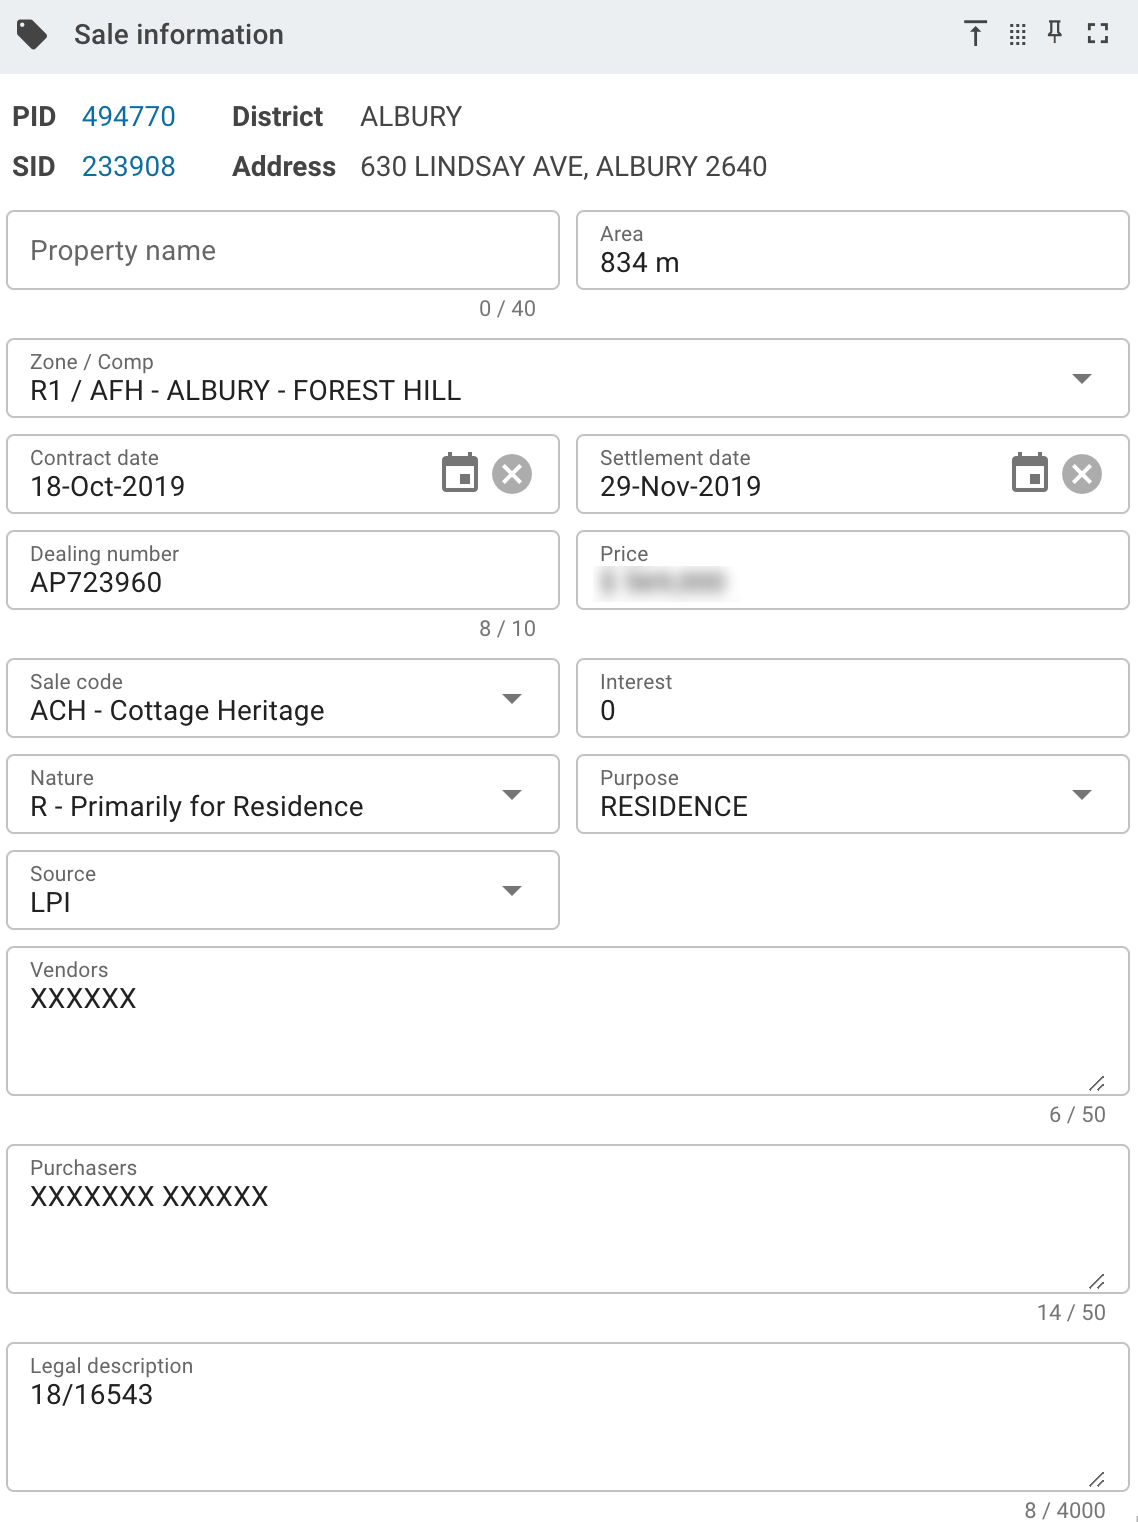
Sale information
This is information brought forward from the sale. You can update this information if you want, but you need to be aware that updating this analysis doesn’t affect the original sale at all. Once you create an analysis, the information is copied from the sale, and the analysis is a completely independent item.
The exception to the above rule is where you have the Contractor | Options | Analyses | Propagate sale code from analysis to sale when saving analysis box ticked.
Note that where you can edit the individual vendors and purchasers in a sale, they are just a series of names in the analysis.
Admin and flags
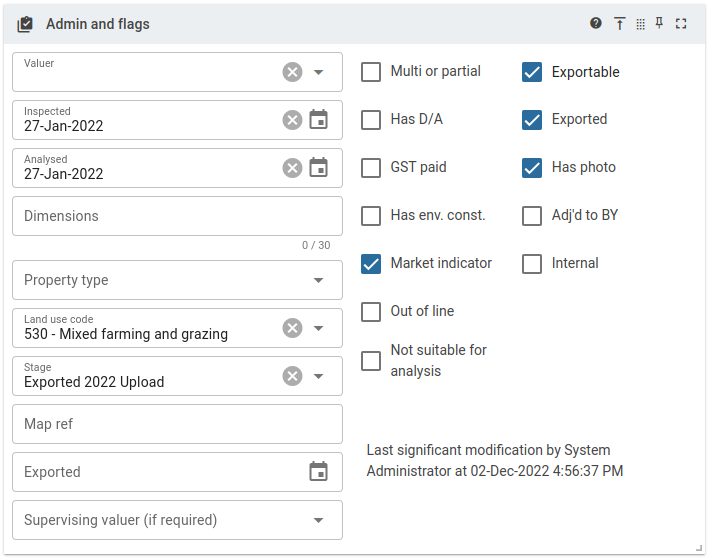
This section deals with administrative information about the analysis. The items you can enter or choose in order to update here are:
- the valuer responsible for the analysis;
- when the property was inspected, and when the analysis was created;
- the property dimensions;
- the property type;
- the land use code;
- the stage of analysis;
- a map reference;
- when the analysis was exported (if applicable); and,
- the name of the supervising valuer.
There are also a series of flags that you can set or clear using tick boxes:
- whether the sale is a multi- or partial-property sale;
- whether there was a DA extant for the property at the time of sale;
- whether the purchaser paid GST when buying the property;
- whether there were any environmental constraints applicable at the time of sale;
- whether the sale was an indicator of the market;
- whether the sale was out of line;
- whether the sale is unsuitable for analysis;
- whether the analysis is current able to be exported;
- whether the analysis has been exported;
- whether the sale has photos attached;
- whether the sale is old, and has been adjusted to the nominated base year; and,
- whether the analysis should be kept as an internal analysis.
Finally, if there has been a significant change to the analysis, the name of the user who made the change and the time at which the change was made are displayed. A "significant" change is when a user updates (or causes to be updated) any of the following fields:
- the market indicator flag
- the not suitable flag
- the out of line flag
- any of the main improvement values (construction, roof, age, size, condition, rate, added value)
- the total improvement value
- the total adjustment value
- the market movement value
- the commercial deduced value
- the analysed LV
- the adjusted LV
- the number of analysed units
- the analysed unit type
- the assessed future LV
- the sale summary.
MVOW will append this date and time (not the user name) to the sale summary in the market data file export. It will look like "Analysis updated on dd-MMM-yyyy."
If the sale summary with the update time appended exceeds 4000 characters in length, some or all of the "last adjusted" text will be lost when generating the market data file. MVOW will truncate whatever text it sees to 4000 characters in order to comply with VG requirements. This will not affect the content of the database.
Improvements
Main improvement
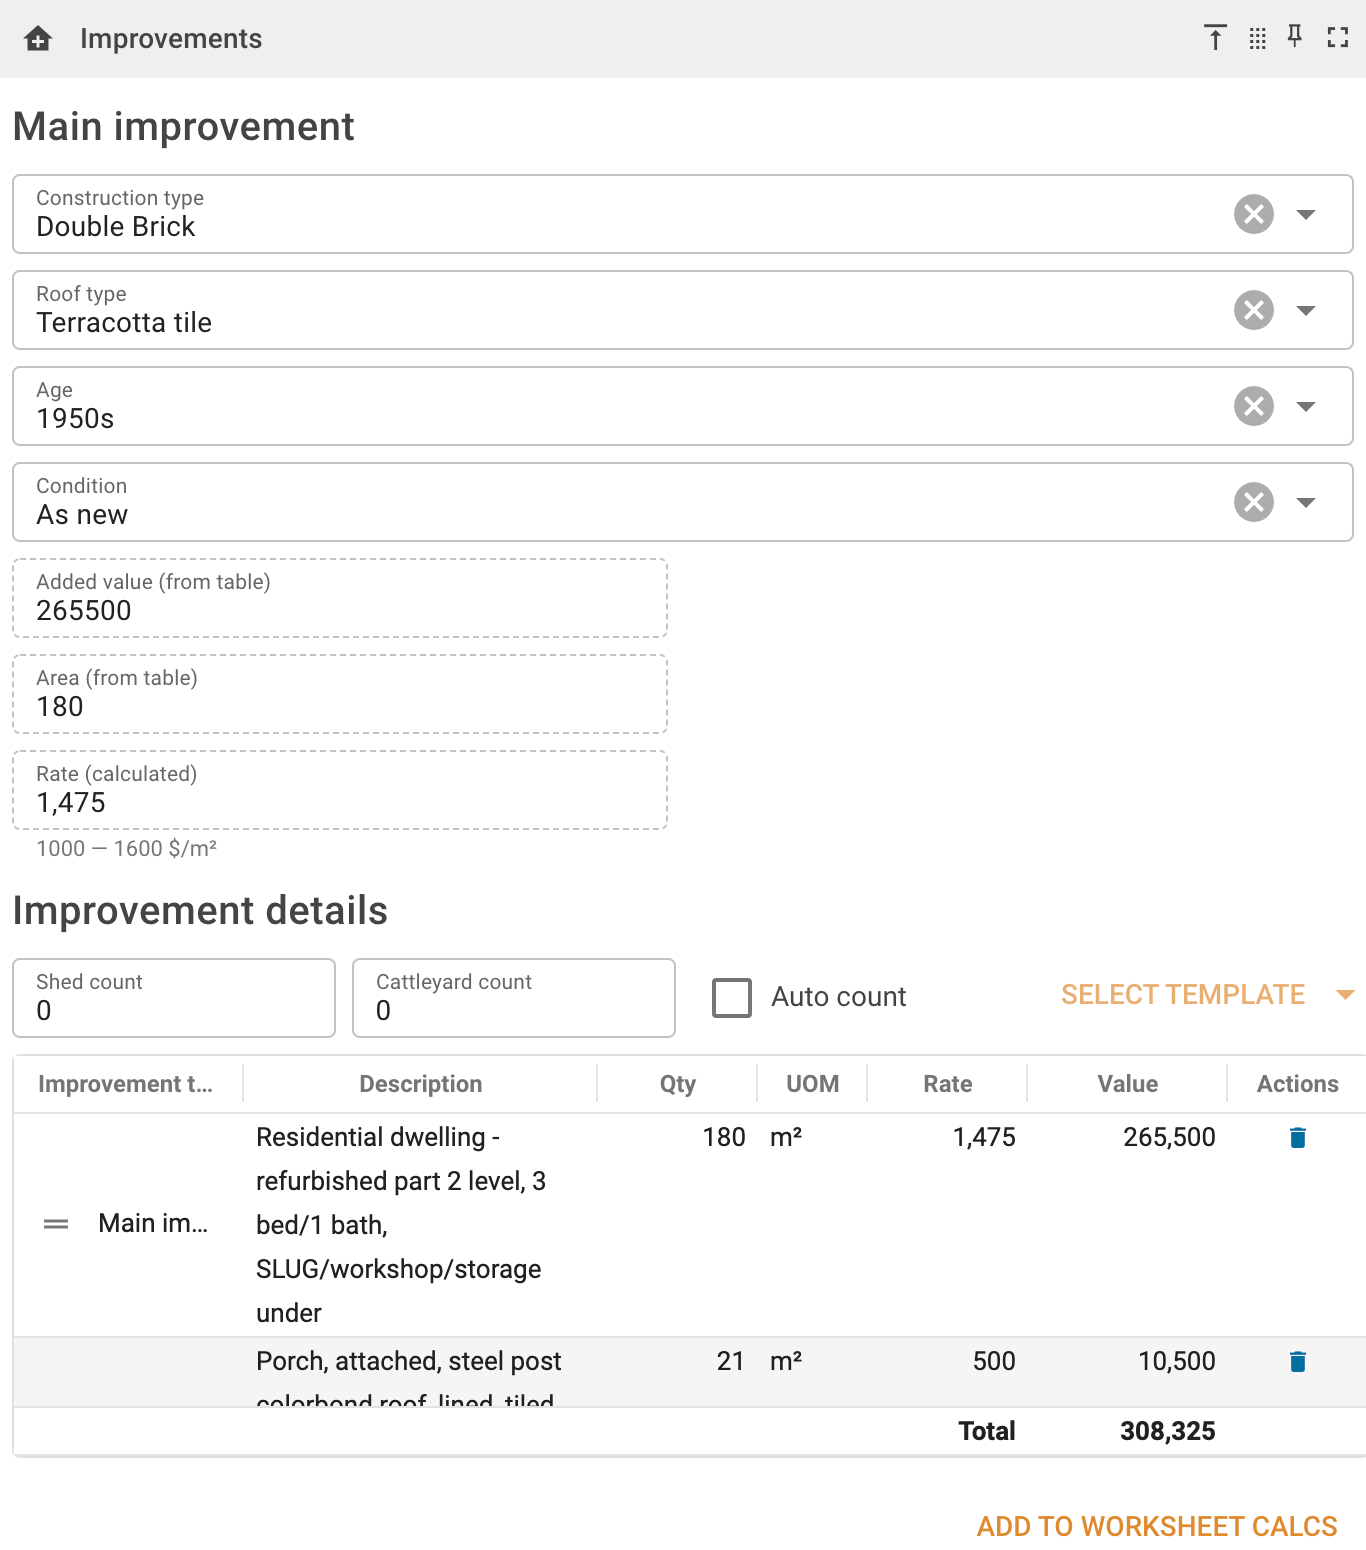
The Main improvement section allows you to specify main improvements, and together, these can be used to determine which part of an improvement schedule applies to the sale. This information is also sent to VNSW in the market data file.
For improved sales, you must provide the following information:
- Construction
- Roof
- Age
- Condition
The system will calculate the added value (sum of Values from main improvement rows in the improvement table), the area of the main improvement (sum of Qty values from main improvement rows in the improvement table) and the rate (the added value divided by the area).
The rate will be shown in green if it's within the range specified in the relevant improvement schedule; red if it is not, or if a relevant schedule doesn't exist.
This section also contains an in-line Integrity check panel that will check the calculations and let you know if anything is missing or wrong.
For more information, See Main improvements in sale analyses.
Improvement detail
The Improvements panel contains a table to which you can add improvements. Click in the empty bottom row of the table to describe the improvement, and then say how much of the improvement there is, what units you’re measuring, and what the rate per unit is. The first column of the table lets you specify the improvement type. The system will calculate the value for you, and add it to the total. Alternatively, you can just enter the value into the last column.
Above the table there are three fields: shed count, cattleyard count and an auto count tick box. If you tick the box, the system will count up the number of Shed and/or Cattleyard improvement rows in the table, and put those values into the fields for you.
The total value of improvements will be subtracted from the price when reaching an analysed value.
You can reorder the items in the table by clicking the arrows at the end of the row, and you can remove an item from the table by clicking the trash can and confirming deletion.
The improvements will be saved when you click the Update button at the bottom of the page.
Development applications
This is a table that contains information about any development applications (DAs) relating to the property you're analysing.

Paired sales
Paired sales analysis can be used to estimate the value of specific attributes, such as improvements. By comparing the sale of two properties that differs only in a single attribute, you can identify the value of that attribute.
For more information, See Paired sales analyses.
Sale adjustments
You work with the Sale adjustments table in the same way you work with the improvements. The sale adjustments are added to the price when reaching an analysed value.
The sale adjustments will be saved when you click the Update button at the bottom of the page.
Commercial lease
If there was a commercial lease at the time of the sale, you can enter the information into this panel. This information will be passed to VNSW in the market data file.
Commercial / industrial replacement cost
You can elect to use the deduced residual land value as the analysed LV in the calculations by ticking the box at the top of this panel. The panel includes a calculator that will help you find a deduced residual land value.
For more information, see The sale analysis "commercial" panel.
Rural analysis
This panel will let you use a more detailed analysis for rural properties including water allowances, land classifications and rural improvements. You can elect to use a rural analysis by ticking the box at the top of the panel. If you do this, the contents of the improvements panel will be moved into the rural panel.
For more information, See The sale analysis "rural analysis" panel.
Rural land classification
This panel will let you provide an analysed land classification for rural properties without having to go through the effort of using the entire rural analysis panel. You can choose attributes and/or enter descriptions for your land classifications along with the amount of land and the rate/ha.
There is a tick box at the top right that you can use to indicate whether this table should be included in the PDF. Whenever you make a change to any item in the table, this box will be ticked. If you want to build the table but don't want it to show up in the PDF, it's best to finish the table before you untick the box.
Unlike the full rural analysis, you're permitted to save the land classifications without the total being within $2,000 of the rural analysed land value. If the difference is greater than $2,000, an error will be reported when you check the analysis before exporting, and in the market data export log.
If the Analyses | Use adjusted LV instead of analysed LV for analysed land classification table in rural classification box is ticked, the overall value in this table will be equivalent to the adjusted LV, rather than the analysed LV. Changes to the adjusted LV will cause the rates and values in the table to automatically adjust to match the same proportion of the new value.
This panel is not available if the Use the rural analysis for report generation box is ticked on the Rural analysis panel; and the data in the table is not editable if the Contractor | Options | Analyses | Edit analysed land classification table in rural analyses instead of normal table box is not ticked.
Calculations
The calculations are adjusted as you update the improvements, sale adjustments and commercial leases. You also enter market movements here as a percentage.
The analysed units are for where you want to have a something other than area used as a measure of the value of the property.
For example, linear metres of frontage, head of breeding cattle, or MgL of water per annum.
You can specify the assessed future land value for it the sale has multiple properties in one line.
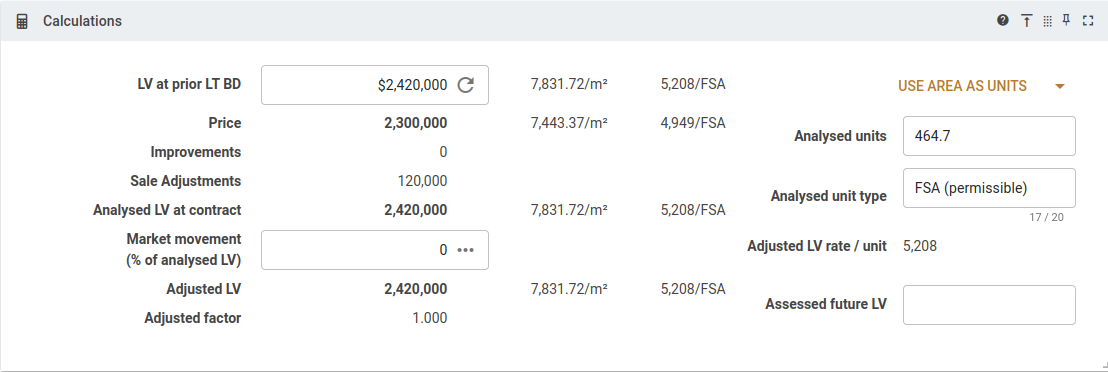
The button shown above with the caption "Use area as units" is a dropdown button, and it contains three items. You can select any one of them to have MVOW automatically populate the Analysed units and Analysed unit type fields. The items are:
- Use area as units
- Use FSA (actual) as units
- Use FSA (permissible) as units
MVOW will also calculate the rate per unit for the adjusted land value and display this in the Adjusted LV rate / unit field.
Sale summary
The sale summary can be entered using the Note editor. You can format the text using most regular styles. This formatting will be applied to the text if it is included in pages within MVOW, and if it is printed in PDF reports.
Please note, however, that this summary will also be used in the market data file that is sent to VNSW. To put this text in the market data file, all formatting will be stripped out, so please ensure that your commentary makes sense as plain text.
You can also use the Make summary button below the sale summary box to create a summary from a form. If you click the button, the page will show a popup containing items that you can specify to make a summary. You can either replace your summary with the generated one, or append your summary to the existing text.
For more information about making summaries, see Summary maker.
Internal notes
The internal notes are entered using the Note editor. You can format the text using most regular styles. This formatting will be applied to the text if it is included in pages within MVOW, and if it is printed in PDF reports.
There are two buttons under the notes that you can click to pull the internal notes from either the PID or the source sale into the analysis' internal notes field. You'll have to save the analysis to keep the changes.
Multi-property PIDs
Where the sale consists of multiple properties in one line, you can enter the PIDs from the other properties here. The PIDs can be on separate lines, separated by spaces, separated by commas, or pretty much any combination of the above. The server will just pick out whole numbers to make the PIDs. Once you've entered the PIDs, click the Calculate button. This will fetch some information, and then make the following changes:
- The area will be set to the combined area of all properties.
- The frontage (on this panel) will be set to the sum of all properties' frontages.
- The description will be set to the legal description (lot/SP/DP) of all properties.
- The prior LV will be set the sum of all properties' prior LVs.
You can also enter dealing numbers into this field if the sale is not strictly in one line (in one dealing). You can enter as many PIDs as you like OR as many dealing numbers as you like ... but you can't mix and match.
You can edit the frontage manually if you want something different to what the system comes up with.
If you use this facility, you should also enter a value for the assessed future value.
Make sure that you tick the Multi or partial box in the Admin and flags section, as this will ensure that the PID for the analysis is left empty (set to NULL) in the market data file for this analysis.
Attachments
The Attachments panel contains a list of all the attachments associated with the analysis’ property. They are displayed in order of whether they are associated with this analysis, and then attachment date and time.
This Attachment table is different to other attachment tables because of the two extra buttons that sit above the list of attachments.
Attach report
Once you’re happy with your analysis, you can have the system generate a PDF and attach it to the analysis. The PDF will include all ticked images, with the first image being used a primary image on the first page of the report. It is recommended that this image be a landscape (rather than portrait) image. Other images will follow the body of the report.
Only images that are ticked will be included in the report.
The system also appends any other PDF documents that are ticked for this analysis.
There is a Contractor option (Analyses | After attaching the report, leave only the report ticked) which, if ticked, will cause the new detailed analysis report to be ticked and all other attachments unticked at the time the report is generated.
Export
You can produce a zip file in the format required by VNSW by clicking the Export button. The page will show a popup, and then commence downloading the zip file. When you have successfully downloaded the zip file, click the
Refresh button on the popup to refresh the page, and see that the Exported flag has been set, and the
Exported date is set to today’s date.
There is a Contractor option (Analyses | Only export ticked PDF documents in sale exports) which, if ticked, will ensure that only ticked PDF documents are included in the zip file. All ticked non-PDF documents will be excluded.
Attachments
You can add attachments to this list by simply dragging and dropping them on to the page, or by clicking the Upload attachments button. Then click Add files… in the popup.
You can delete any attachments from the property by clicking the Remove  button. The system will ask you if you’re sure you want to do this, because deleting the attachment will remove it from any analyses, supps and/or worksheets.
There are two buttons at the bottom of this section: Tick all and Untick all. You can click these buttons to have all the attachment tick boxes set or cleared, respectively.
ANYTHING YOU DO WITH ITEMS IN THIS PANEL WILL BE RECORDED ON THE SERVER IMMEDIATELY.
You don’t have to click the Update button in order to have these changes become permanent.
Attachment folders
The Attachment folders panel provides a tree view of attachments associated with the analysis' property. Attachments are split into folders based on the corresponding analyses, worksheets and properties. They are displayed in order of attachment date and time to start with, but if you rearrange them the order will be retained. Order is saved per-folder. Ensure that any changes to order are made in all required folders, not just one.
This Attachment folders panel is different to other versions because of the two extra buttons that sit along the bottom edge.
Attach report
Once you’re happy with your analysis, you can have the system generate a PDF and attach it to the analysis. The PDF will include all images in the analysis folder, with the first image being used a primary image on the first page of the report. It is recommended that this image be a landscape (rather than portrait) image. Other images will follow the body of the report.
Only images that are in the primary (starred) analysis folder will be included in the report.
The system also appends any other PDF documents that are ticked for this analysis.
There is a Contractor option (Analyses | After attaching the report, leave only the report ticked) which, if ticked, will cause the new detailed analysis report to be added to the analysis folder and all other attachments removed at the time the report is generated.
Export
You can produce a zip file in the format required by VNSW by clicking the Export button. The page will show a popup, and then commence downloading the zip file. When you have successfully downloaded the zip file, click the Refresh  button on the popup to refresh the page, and see that the Exported flag has been set, and the Exported date is set to today’s date.
There is a Contractor option (Analyses | Only export ticked PDF documents in sale exports) which, if ticked, will ensure that only PDF documents in the analysis folder are included in the zip file. All non-PDF documents in the analysis folder will be excluded.
Attachment folders
Folders are presented in a tree on the left side of the panel. The currently selected folder is highlighted in grey. Folders can be switched by clicking on the desired folder's name in the tree.
The panel can be switched between grid view and tile view.
Tile view
Tile view is very similar to the existing attachments panel, with all attachments within a folder laid out as preview tiles.
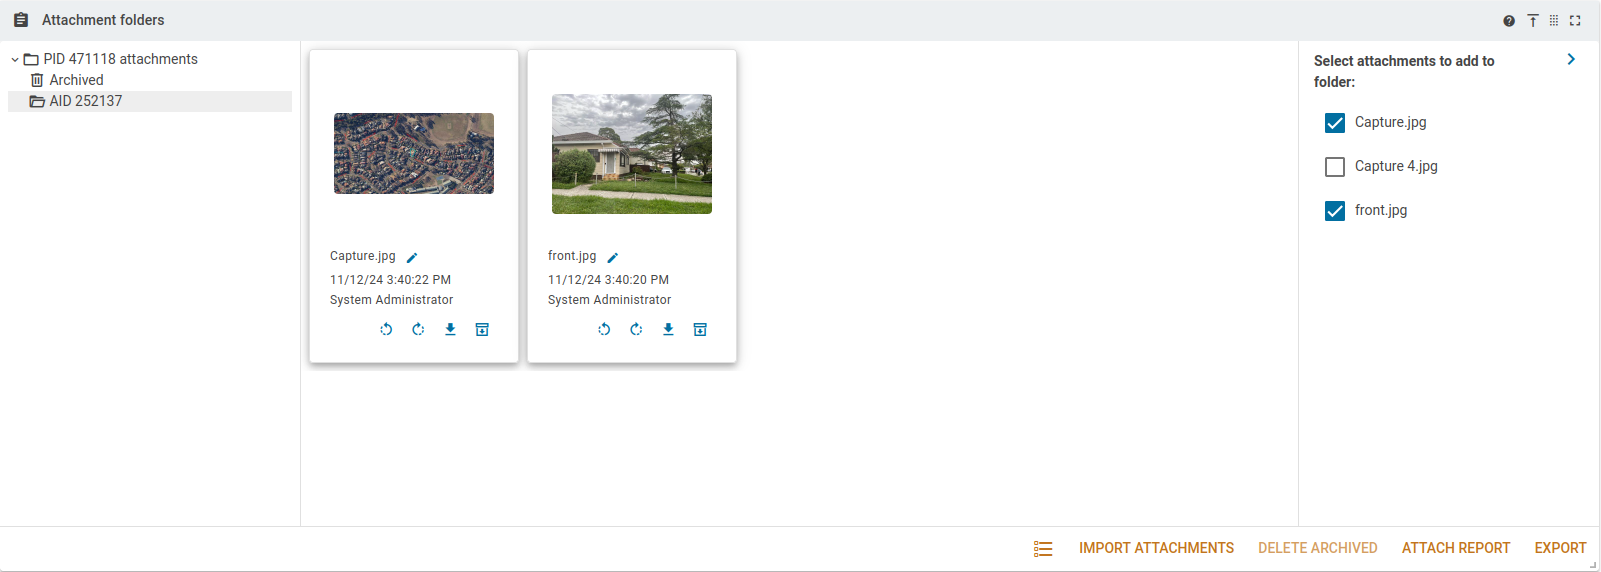
Grid view
Grid view presents the attachments as a table of values. Attachments can be rearranged by dragging the triple bar icon in grid view, or by dragging the tiles around in tile view.
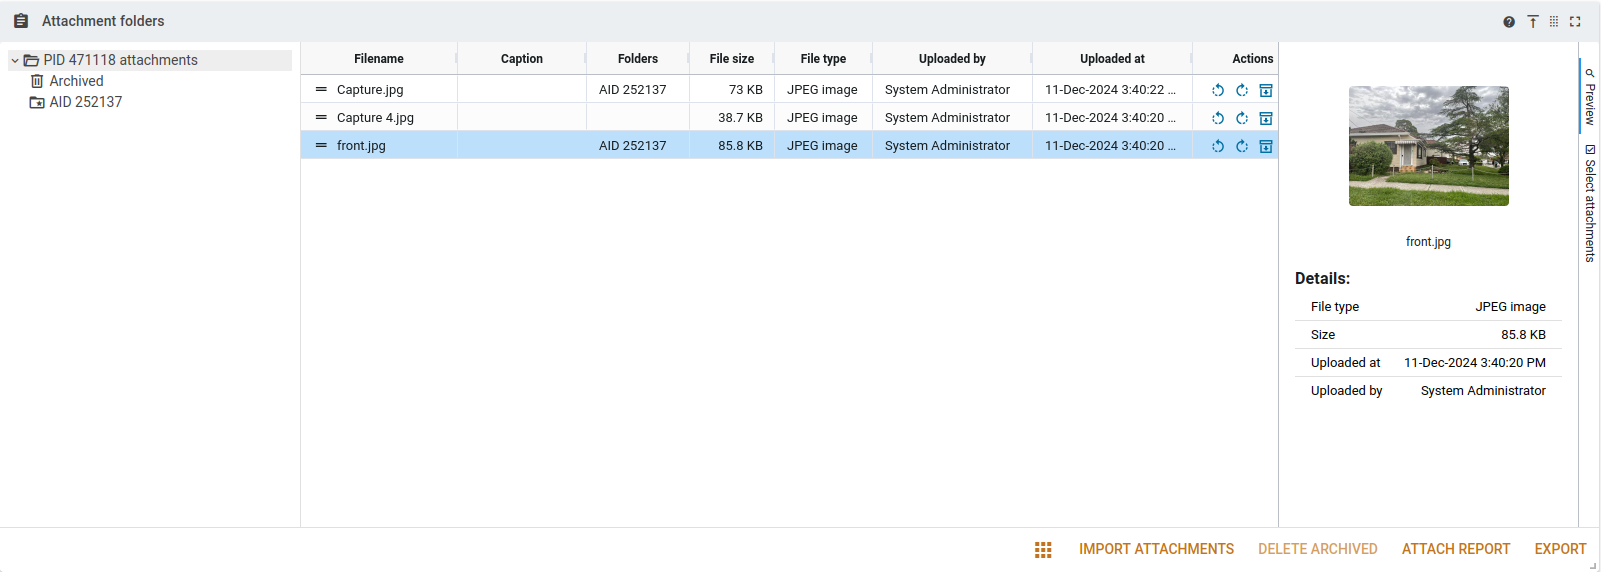
To copy attachments to different folders (e.g. from the property to an analysis), the rows in grid view can be dragged and dropped onto the folders in the tree on the left. Dropping rows onto these folders will copy attachments, unless dropped onto the Archived folder, which will remove them from all folders and move them to the archive. Multiple rows can be selected by shift-clicking them. Dragging any of the selected rows will copy all of the selected attachments in one move.

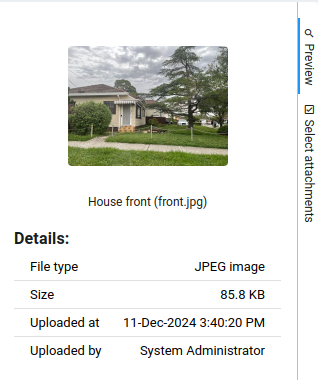
In the grid view, a preview tab is present on the right side. When a single row is selected, this tab will present information about the corresponding attachment, as well as a preview. The tile view does not have this preview tab.
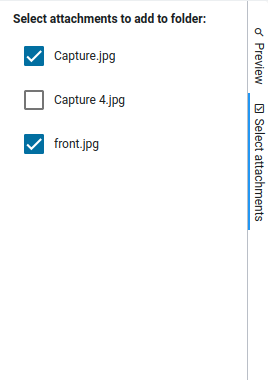
When in either view, attachments can be quickly added to a folder using the Select attachments tab. This tab provides a checkbox list of all attachments on the property. Checking the corresponding box will copy the attachment into the currently selected folder. Unchecking will remove it. This list is not available in the Archived or property folders.
You can add attachments to a property by dragging and dropping them on to the page, or by clicking the Upload attachments button. Then click Add files… in the popup. Note that attachments are only added to the default folder (denoted by a starred folder on the left) and the property folder. Further arrangement should be handled using the folder view itself.
When in a folder, you can archive any attachments by clicking the Archive ![]() button. This will move them to the Archived folder. When in the archive folder, you can delete any attachments using the Remove
button. This will move them to the Archived folder. When in the archive folder, you can delete any attachments using the Remove  . Alternatively, archived attachments can be moved back to the property folder using the Unarchive
 ![]() button. If desired, all archived attachments can be deleted using the Delete archived button. The system will ask you if you’re sure you want to do this, because deleting the attachment will remove it from any analyses, supps and/or worksheets.
button. If desired, all archived attachments can be deleted using the Delete archived button. The system will ask you if you’re sure you want to do this, because deleting the attachment will remove it from any analyses, supps and/or worksheets.
ANYTHING YOU DO WITH ITEMS IN THIS PANEL WILL BE RECORDED ON THE SERVER IMMEDIATELY.
You don’t have to click the Update button in order to have these changes become permanent.
This panel is intended to be used instead of the Attachments panel. Simultaneous use of both panels may have unpredictable effects. Please only use one or the other at a time.
Map
The Map panel provides a map view of the property being updated. For properties, this is the property associated with the current PID, whilst for analyses, it is the property associated with the PID for the current analysis.
This map panel functions very similarly to the mapping side panel found in the search results, including the presence of the pop-up map layer menu. This includes all of the layers you would normally find in the MVOW map anywhere else in MVOW. Unlike the MVOW mapping side panel, this editor map panel includes a Map reset button. You can click this button to reset the map view and selection to the current PID if you've lost it while looking around in the map.
This panel can only be used with Mapbox MVOW maps. If you are using a Google API key, this panel will simply display an informative error message.
Benchmarks
If this analysis has been used to support a benchmark valuation in a Component report page, that relationship will be listed here. You can follow a link to a component report or the benchmark property that the analysis supports.

You can unlink the analysis from a component report by clicking the Unlink  button. After confirming, the link will be broken. The change will be applied immediately, and you won't have to click the Update button to make this change permanent.
Note that this will also remove any comparison text you may have entered when comparing this analysis to the relevant benchmark.