Appearance
Component reports
This page lists the components in all licensed districts.
The rows are listed by district, then zone, then component code, but you can sort by any column. The columns in the table are as follows:
- Team - The name of the team responsible for the component.
- District
- Zone
- Code — A link to the component report. Click to open the report in a popup, this tab or a new tab.
- Description — Component description.
- Comp valr — Displays the name of the valuer responsible for this component (Reference items | Components). This column will be hidden if Contractor | Options | Component reports | Hide the component valuer and review date on the component list is ticked.
- Reviewed — Last review date. This column will be hidden if Contractor | Options | Component reports | Hide the component valuer and review date on the component list is ticked.
- Factor applied for the future year.
- N/H flag — Displays Yes if non-homogeneous, blank otherwise.
- Rpt val — Displays the name of the valuer responsible for this component report.
- Val date — The valuation date on the component report.
- Delivery date — The LGA's delivery date.
- Stage — Displays the stage of the component report. This is editable on the grid: you can double-click an individual cell to edit it or click one cell and drag up or down. Changes are saved immediately. Choose from stages created in Reference items | Component report stages.
- Complete — A flag indicating whether the component is complete. This is editable on the grid: you can click individual tickboxes or click one cell and drag up or down. Changes are saved immediately. You will not be able to add tickboxes to components that don't have them by filling up or down from components that do; and you can't remove tickboxes by filling up or down from an empty cell. You can fill from a tickbox down to other tickboxes, bypassing cells that don't have them.
- Props — The number of properties in the component. Click to see all of the component's properties in a Property search results page.
- Sales — The number of sales in the component with contract dates between Sep-01 of the LT year and Aug-31 of the future year. Click to see these sales in a Sale search results page.
- Target — The number of sales that should be analysed in this component based on the Must analyse (VNSW) rules (you'll have to scroll down on that page to see these rules).
- Mkt anlys — The number of market analyses in the component. Click to see all of the component's market analyses in a sale analysis search results page. A market analysis in this case is adjusted to the future base date, not marked as internal, flagged as a market indicator, not out of line, and not unsuitable.
- Fut CR — A link to the future year component report.
- SALVR — A link to the sale analysis / land value range report for the future year.
- VM — A link that will transfer all of the component's properties into the desktop ValMap.
- GIS — A link that will transfer all of the component's properties into the ValMap portal.
- MVM — A link that will transfer all of the component's properties into MVOW mapping.
Bulk link analyses
Select multiple rows and right-click to see the context menu. Assuming the feature is enabled, you'll see a menu item with the caption Pick AIDs for benchmarks of all selected components. If you choose this, you'll see a popup like the picker described below. This will contain a list of all market analyses for the future year in the current district. Pick the analyses and click Link BMs to have all linked analyses for all selected components replaced by these analyses. The future component reports must already have been saved, and to have proper comparisons generated, the PIDs associated with the analyses must have future values.
This menu item will only be available if all selected components belong to the same district.
Update report component
If there is no future year component report for the component, you will see a panel at the top of the page that will offer to bring forward the component report information from the prior year. This includes the comments, valuer, handcrafted flag, benchmark property comments and associated sales. Note that the sales that are introduced by this process will be adjusted to the current LT year, so won't be of use in the final report. However, it gives you a place to start.
The top row of this page gives you the ability to choose a different base year so that you can review historical component reports. This is not available if you're viewing the component report in a popup.
You can also click the Refresh  button to reload the component report.
The (Re)apply factor button lets you apply the factor (or reapply the factor) to the properties in the component without you having to change the factor and click the Update button. For more details, see How does the "Factor application" box work?.
If you have ticked the Enable the automatic valuation methodology process box in your contractor options, you can click the Apply auto val meth button to start that process. For more details, see Automatic application of valuation methodologies.
The Update button will save your changes. If you've altered the factor, the system will ask which properties should have the factor applied. For more details, see How does the "Factor application" box work?.
Component info
The top row of this panel contains a few different buttons and controls.
- Find XXX properties button — Puts the list of this component's properties into a Search results page in a new tab.
- Show stats button — Shows a popup containing the statistics for this component / base year.
- Web button — Opens the component report in a popup.
- PDF button — Downloads the PDF version of the component report.
- SALVR button — Opens the Sales and Land Value Range chart for the component / base year in a new tab. component report for that year.
- A ValMap
 button:
 - Press the icon part of the button or Whole component from the drop-down menu to view all component properties in ValMap.
- Choose the All benchmarks menu item to view all benchmark properties in ValMap.
- Choose the All benchmarks and their sales menu item to view all benchmark properties and all related sales in ValMap.
- Choose the Selected benchmark menu item to view only the benchmark property from the selected tab in ValMap.
- Choose the Selected benchmark and its sales menu item to view only the benchmark property and the related sales from the selected tab in ValMap.
- Choose the All benchmarks and all XXX analyses menu item to view all benchmark properties and all analyses from the selected component in ValMap.
- Choose the All benchmarks and all XXX market analyses menu item to benchmark properties and all market indicator analysis from the selected component in ValMap.
- A ValMap portal
 button with the same options as the ValMap button, except the properties will be highlighted in the ValMap portal.
The next section is the main part of the component report, where you include your comments, the factor applied to the component, the valuer responsible for the component, the date the component was valued, a flag to say whether or not you regard the component as handcrafted, and a component report stage.
There is also a Report complete tickbox that you can tick to indicate that the report is complete. This will be used to populate the % compl column in the Component reports dashboard panel.
Component stats
The component stats panel provides statistics about the component in three cards within the panel. Where any of the statistics have values that would cause an AVA error, they will be shown in red. You can hover over red highlighted values to be shown the reason why it causes an error.
- Property stats shows stats about the properties and benchmarks in the component.
- Quartiles shows the values of the land value quartiles within the component.
- Sale stats shows stats relating to sales and analyses, including the COD, MVP, PRD, COAVC, and AVM factor.
Benchmarks
This panel contains one tab per benchmark. You can't specify which properties are benchmarks from this page; you need to visit the property entry itself to change that.
To the right of the benchmark tabs, there is a Pick benchmarks button. This button's function is described below.
For each benchmark property, you can enter the benchmark comments. If these aren't set, the system will pull in the land description from the property as the note.
You should also set (or simply check) the property type, property type sub-category and tick a box that says that you've checked that this is correct. These values are required for the market data export as of file spec 1.9.4 (fields 5D-6 and 5D-7). The reason we have the Checked box there is so that you can associate default benchmark property types and sub-categories with the component. If these associations exist, the system will bring these into the component report automatically. However, they might not suit your particular benchmark, so you have to check (or at least, say that you've checked).
You can also associate one or more analyses that support the benchmark valuation. To find the analyses, there are a number of buttons under the Analyses table that will help you. In the table below, XXX represents the current component.
| Button | Action |
|---|---|
| Make comparable | Replace the contents of the benchmark's comparable sales with these analyses. |
| Recycle analyses | This functionality is described below. |
| Find XXX sales | Opens a new tab with a sale search for sales in the component that have contract dates between September 1 of the previous year and October 31 of the report year. |
| Find XXX anlys | Opens a new tab with an analysis search for analyses of sales in the component that have been adjusted to the report year. |
| Find XXX m.anlys | XXX is a component code. Opens a new tab with an analysis search for analyses of market sales (market indicators, not out of line, not market leaders, not unsuitable) in the component that have been adjusted to the report year. This is a split button with the target functionality described below. |
| Find XXX m.anlys | XXX is a zone code. Opens a new tab with an analysis search for analyses of market sales (market indicators, not out of line, not market leaders, not unsuitable) in the LGA / zone that have been adjusted to the report year. This is a split button with the target functionality described below. |
| Fetch from W/S | Add analyses from the benchmark PID's worksheet's comparison sales. |
| Copy AIDs | Copies the AIDs of the analyses already included in the table. |
| Add AIDs | This is a dropdown button.
|
In the analyses table, each analysis has a PID link and an analysis link in the first column. You can also click the … to show a popup that contains the sale summary for the analysis.
There are two comparison fields: Fixed comparison and Comparison. The Fixed comparison column is for comparison text that doesn't change when either the benchmark land value or the adjusted land value changes. The Comparison column text can be regenerated if either of those values change, if you have your contractor options set up for this to be done. The two values will be concatenated for inclusion in the both the market data file and the PDF component report.
The Fixed comparison text is related to the Contractor | Options | Component reports | Store the fixed comparison on the analysis instead of the component report setting. If the option is not ticked, then the fixed comparison text is stored with the component report, and every time an analysis is represented in a comparison, you can type something different. If the option is ticked, the same fixed comparison will show up wherever the analysis is used, and the fixed comparison will be populated if a fixed comparison already exists somewhere.
If the option is ticked, you can change the fixed comparison text in the Benchmarks panel on the Analysis update page.
If you have the My settings | Press tab to jump to next comparison in component reports option ticked, pressing tab while editing a Fixed comparison cell will automatically jump down to the cell in the next row, rather than move to the next column.
If you tick the option when it has never been ticked before, all of your fixed comparisons will disappear from the component report form and from reports. This is because the system will start using the comparison from the analysis instead of the one stored with the component report.
You should make sure you copy your fixed comparisons to the analyses before you tick this option.
You can click the Remove  button at the end of the row to remove the analysis from the benchmark, or you can click the Remove button at the top of that column to remove all of the analyses from the benchmark. Remember to click the Update button to save these changes.
Picking benchmarks
Click the Pick benchmarks button to show this popup:
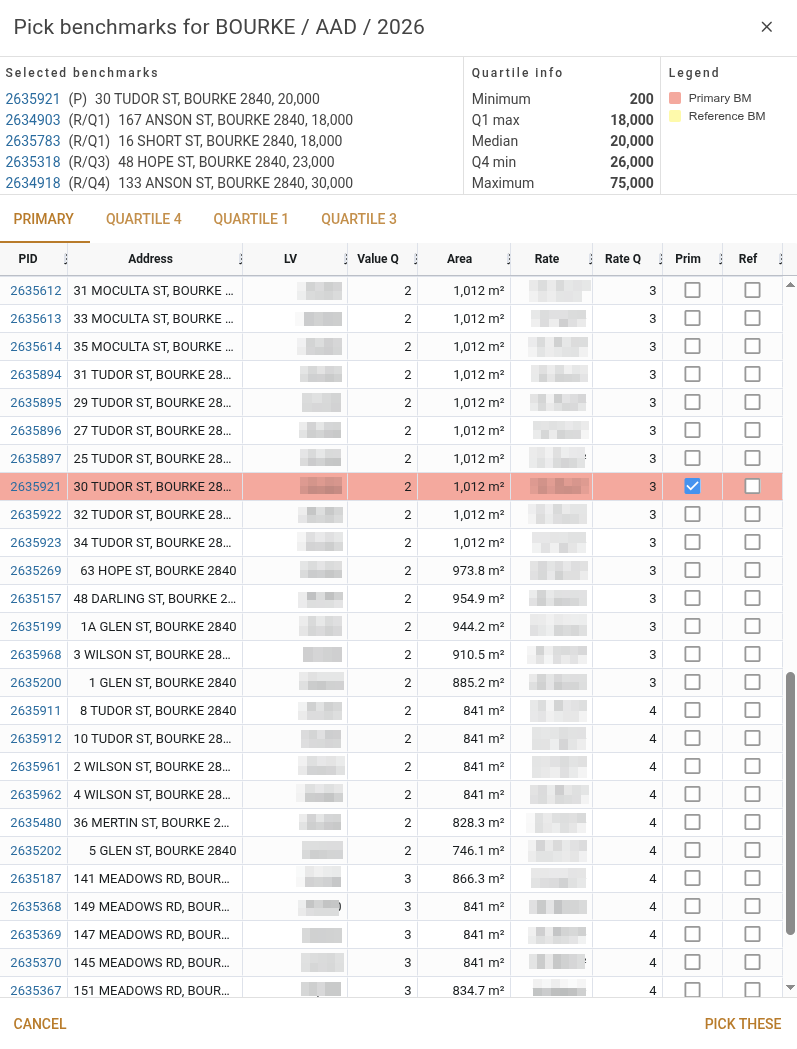
The properties in the Primary tab are those that meet the criteria required for being a primary benchmark. If you want to select a new primary benchmark, you can tick the box in the Prim column.
If you see a property you want to use as a reference benchmark, you can tick the box in the Ref column.
The popup will have extra Quartile tabs based on the number of reference benchmarks required. The system uses the land value QRP and the number of properties in the component to determine this count.
When you have selected the benchmarks you require, click the Pick these button. The system will make changes to the database so that the newly chosen benchmarks have the benchmark type and risk rating set appropriately; the outgoing benchmarks will have the benchmark type cleared, and the risk rating changed to the default risk rating.
Recycling analyses
When you open a component report for the first time in a new year, the system will offer to carry forward information as described above. The analyses that you may see attached to the component report will be for the prior year. If you want it to, MVOW can associate future year analyses with the benchmarks, or create new analyses based on the existing (adjusted to the LT year) analyses.
Start the process by clicking the Recycle analyses  button. It will be disabled if any of the following are true:
- The component report's year is not the future year.
- There are no analyses, and so nothing to recycle.
- There are no prior year analyses linked to the benchmark.
- The component report has never been saved.
- There are changes that haven't been saved.
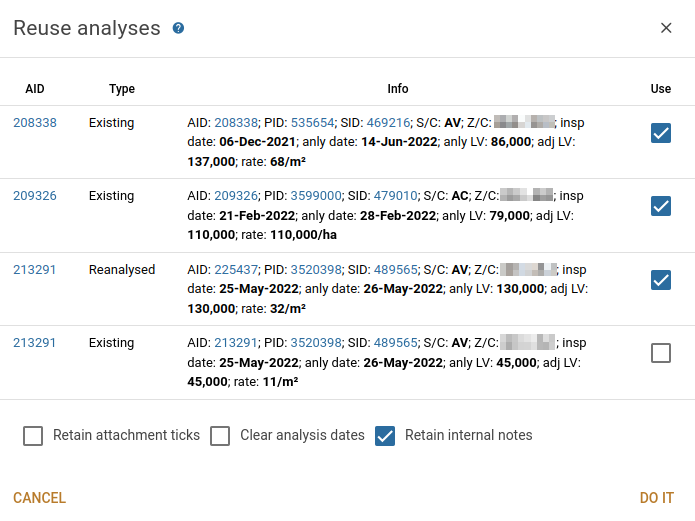
Assuming you can proceed, clicking the button will result in a popup like the following:
Picking analyses
When you click a Target  icon in one of the Find XXX m.anlys buttons, the system will open a popup looking like this:
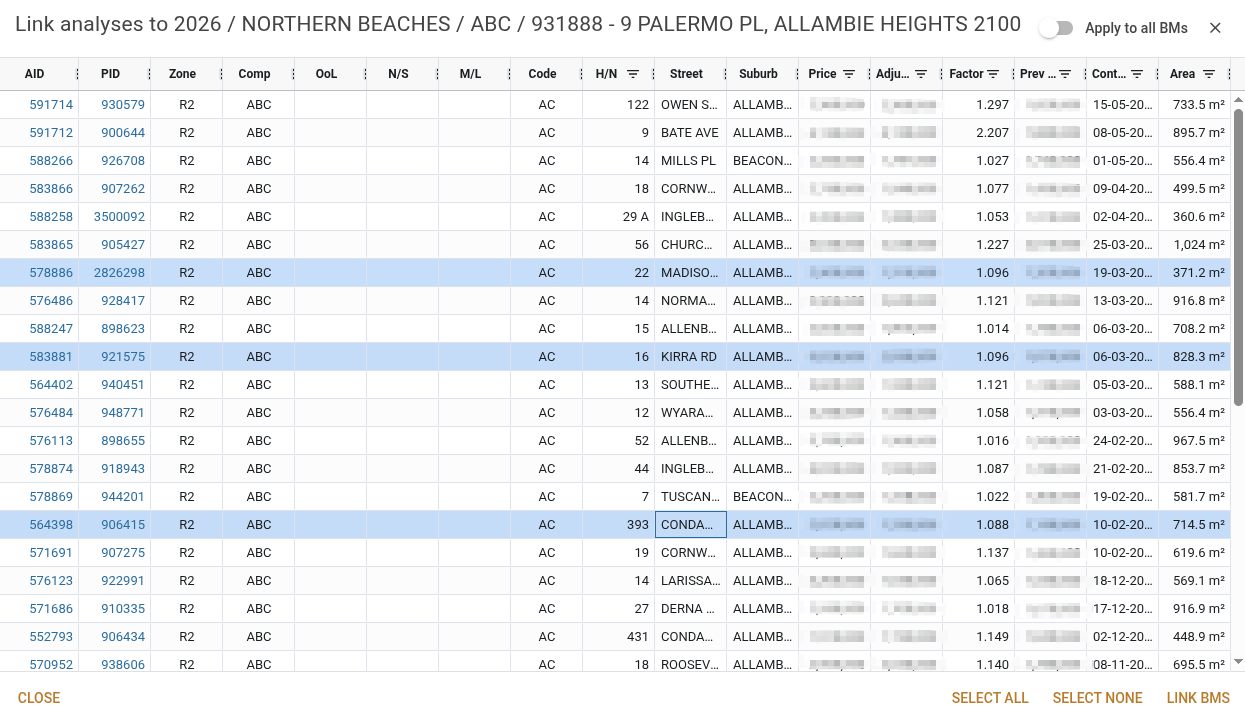
You can click the Target icon to have the list populated with analyses limited to the component, or to the LGA / zone.
Click a row anywhere except the AID or PID to select the analysis; click again to deselect. When you have the selected the analyses you want to include in your component report, click the Link BMs button at the bottom right of the popup. The analyses will be added to the list of analyses you already have linked to your benchmark.
There is a Apply to all BMs switch at the top right. Turn this on to have your selection copied to all benchmarks; leave it off to copy them only to the currently selected benchmark. The system will remember your last setting for this switch.
The PID and AID links are regular links, and you will need to click them with your mouse wheel button to open them in a new tab. Alternatively, you can Ctrl + right-click to see the regular context menu and choose Open link in a new tab.
AID column
The AID column contains the AID that is currently associated with the benchmark. You can click it to open the analysis in a new tab.
Type column
There are three classes of analysis recycling:
- No relevant future-year analyses (existing).
- Reanalysed future-year analysis (reanalysed).
- Resold future year analysis (resold).
Existing analysis: this is where the only relevant analysis is the one from the LT year. If you tick an "Existing" analysis, MVOW will create a new analysis as a clone of the existing one, adjusted to the future year. The system will retain attachment ticks, clear analysis dates and/or retain internal notes as you require.
Reanalysed: this is where the analysis' sale already has a future analysis associated with it. If you tick a "Reanalysed" analysis, MVOW will associate the future analysis with the benchmark, displacing the LT analysis. The preferences for attachment ticks, clearing analysis dates and retaining internal notes will be ignored.
Resold: this is where the analysis' PID has a later sale that already has a future analysis associated with it. If you tick a "Resold" analysis, MVOW will associate the analysis of the later sale with the benchmark, displacing the LT analysis. The preferences for attachment ticks, clearing analysis dates and retaining internal notes will be ignored.
Info column
This column contains information about the analysis that will be replaced (in the case of Existing analyses), or the analysis that will be used to replace the existing one (in the case of Reanalysed or Resold analysis).
Use column
This column contains tick boxes that you can use to indicate the analysis with which you want to replace the existing one.
Note that an existing analysis may have multiple possible replacements, and you will only be able to tick a single replacement.
Executing the recycling operation
Once you have the selections you want, you can click the Do it button. The system will make the replacements you request, and then reload the component report.