Appearance
Mapping
You can't navigate directly to the page from the menu; it's only accessible by clicking the MVOW mapping  button from somewhere on a page.
By default, we use Mapbox for our mapping. If you want to Google Maps instead, you'll need to follow the instructions here: Configuring Google Maps API keys. Where that article talks about the Street View Static API, you should be working with the Maps JavaScript API.
Why use Google Maps instead of Mapbox? Google Maps sometimes provides higher resolution satellite imagery in city areas.
If you use Mapbox instead of Google Maps, and have added a Nearmap API key in Contractor | Options | Integrations | Nearmap API key, you will also have the choice of a Nearmap view in the base map selector dropdown. Nearmap provides much higher resolution imagery than the standard Mapbox satellite view.
Caveat
There may be bugs, and we can guarantee that you're not going to be able to find all of the functionality you need. Please let us know what you're missing, and we'll do what we can to bring it to life.
Our list of features to be added are as follows:
- Add a "limit" tree item where you can tick zones and components. The map will only display text and thematic layers for properties in these zones and/or components.
Base level functionality
The mapping view
There are certain things we've been able to provide with no extra effort.
- Selection of Street or Satellite view. You'll be able to discern better than me what's up to date and what's not, but that's what's there.
- Full page view. You can click the square with the four arrows in the top right of the map, and it will expand to fill the whole screen. Click in the same box (or press Escape) to revert to the regular view.
- Street view (Google Maps only). You can drag the yellow "Pegman" and drop it anywhere on the map with the blue line that comes into view when you start to drag it. The map will change to Google's street view, and the regular functions are available there. Click in the back arrow at the top left of the view to return to the regular map view.
- You can zoom in and out by rolling the mouse wheel and you can pan around by clicking and dragging on the map.
Selecting properties
You can Ctrl+Click a property to toggle whether the property is selected.
You can Shift+Click and drag to create a rectangular area. When you let go of the mouse button, all of the properties completely contained within the rectangle will be selected. All other properties will be deselected.
On-map controls
There are tool panels at the top left and top right of the map.
Top left
Zoom / orientation
| Button | Description |
|---|---|
Refresh  | Refresh the data on map from the database. Useful if you want to see changes without zooming in or out, or panning to force a data refresh. |
Select none  | Deselect all properties. |
Select  | Allows you to click in an anchor location and then click somewhere else to define a selection area. Any property that intersects with this rectangle will be selected. If you hold down the Ctrl key when you click the second time, your original selection will be retained. Otherwise, all other properties will be deselected. |
MVOW search  | Transfer any selected properties into a property search result page in MVOW. |
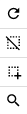
Annotations

| Button | Description |
|---|---|
Line  | Draw a line on the map. Click to start, double-click to finish. |
Polygon  | Draw a polygon on the map. Click to start, double-click to finish. |
Delete  | Delete the selected annotation from the map. |
Measurements

| Button | Description |
|---|---|
Measure length  | Measure the length of a line or the perimeter of a polygon. |
Measure area  | Measure the area of a polygon. |
Top right
Selection / transfer

| Button | Description |
|---|---|
Zoom in  | Zoom in to show more detail. |
Zoom out  | Zoom out to show more features. |
Reset bearing  | Click to realign the view so that the top of the map is north. |
Full screen
| Button | Description |
|---|---|
Full screen  | Cause the map to take up the full screen. |
Base map
| Button | Description |
|---|---|
Base map selector  | Choose whether to use a regular street map, satellite view, or Nearmap images (requires Nearmap API key) as the base map. |
Control panel
The control panel (to the left of the map) consists of three sections:
- A command bar
- A toolbar
- A features panel
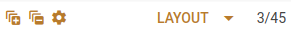
Command bar
The command bar looks like this:
| Command | Description |
|---|---|
Expand all  | Expand all items in the features panel. |
Collapse all  | Collapse all items in the features panel. |
| Settings | Show a popup that will let you configure the annotations text and boundary lines. |
| Layout menu | The layout menu lets you duplicate the current layout in terms of what items in the tree are expanded, what items are ticked, what colours are associated with the different thematic layers, and any range customisations. You change choose which layout to apply to the map, and you can also manage your layouts (create, rename, reorder, delete, export and import layouts). |
| Selection info | These numbers tell you how many properties are selected and how many are showing on the map. |
Settings
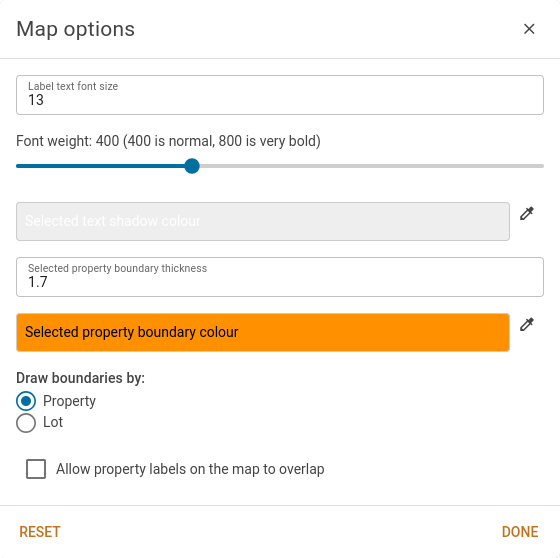 | The settings popup provides various customisation options for the appearance and functionality of the map. Most of the options control font sizing, weight and various colours. Each option is labelled. Under the font and colour options is a control for boundary drawing. This allows you to change the boundaries and certain features to reflect either properties, or their lots. Boundaries will be drawn around either lots or properties, and details such as the calculated area and legal description will be updated accordingly. The two checkboxes at the bottom control the drawing of text labels on properties. Allow property labels on the map to overlap causes the map to only render a subset of the property labels in densely populated areas if the property labels would overlap. Highlight corrected LT and regraded FUT values in red colours LT verified land values in red if they differ from the LT land value, and colours FUT land value and FUT verified land values in red if the property has a valuation methodology of 'REGRADED'. |
Features panel
The features panel contains a tree of items. These items can be expanded or collapsed by clicking the expansion arrow or the name.
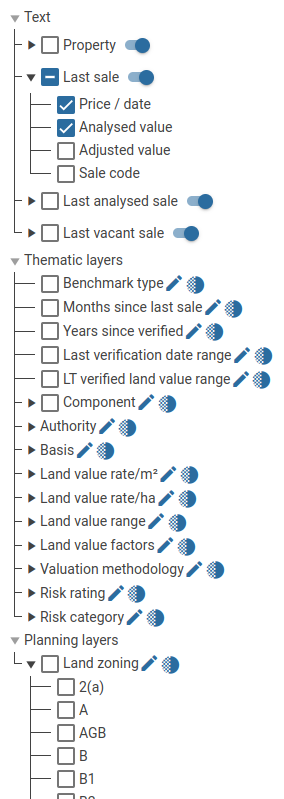 | It's worth noting that the behaviour of the tick boxes on internal nodes behave a bit differently to the ValMap equivalents. You don't have to tick the box in order to have the box expanded or to select any of its children. The tick box on a parent allows you to tick or untick all of the parent's children in one click, and it also gives you an indication if any of its children are ticked. If none of a parent's children are ticked, the parent will be unticked. If some (not all) of the parent's children are ticked, the parent will have a dash in the tick box. If all of a parent's children are ticked, the parent will also be ticked. The switch to the right of the parent lets you control whether those text items are going to be displayed. This allows you to turn them all on or off without ticking or unticking anything. You can click the pencil icons to edit a thematic layers colours and ranges. Not all thematic layers have editable ranges. The half shaded circles allow you to adjust the opacity of the corresponding layer. Simply click the circle and drag the slider to change the opacity of the layer. You'll see your changes reflected on the map and your changes will be saved immediately. |
Editing a thematic layer without ranges
If you click the Edit  button on the Authority, Basis, Benchmark type, Component, Valuation methodology, Risk rating or Risk category item you'll see a popup like this:
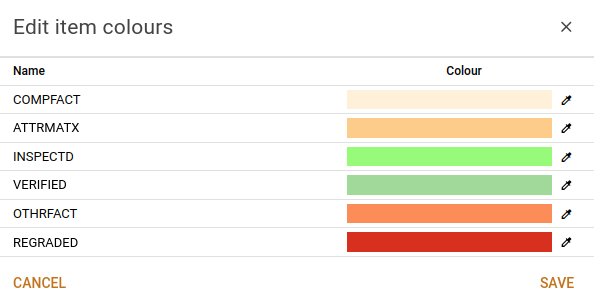
You have the ability to edit the colours by clicking the Edit  button on the right of the colour band. You'll get a popup that looks like this:
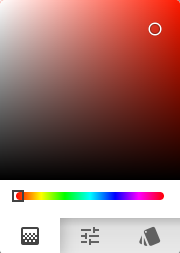
You can move the frame along the spectrum to choose your hue, and then move the dot around the top part of the picker to choose the lightness and saturation. There are tabs at the bottom of the picker that will give you different ways of choosing the colour.
Click the Save button on the popup when you've completed changing your colours.
The colours you choose will be saved so that next time you open a map with this layout selected, your colours will be there.
You can enable or disable specific categories using the enable switch. If disabled, a category will not render on the map. The toggle in the Enabled header can also be used to toggle all layers on or off quickly.
Editing a thematic layer with ranges
If you click the Edit button on the Months since last sale, Land value rate/m², Land value rate/ha, Land value range or Land value factors item you'll see a popup like this:
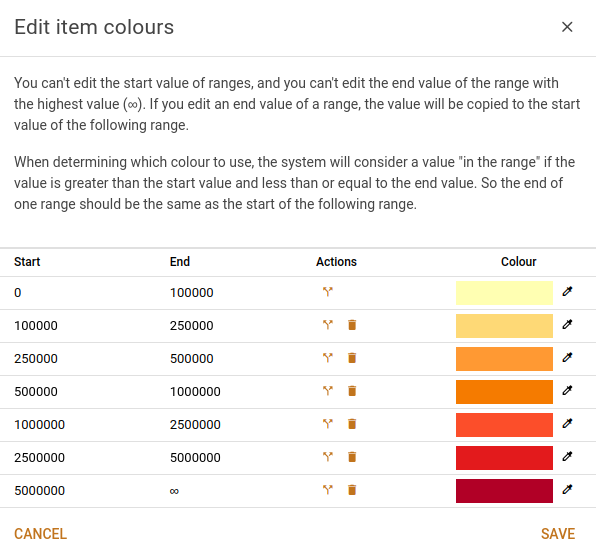
The colours behave in the same way as the editor above.
Click on the Split range  button to split a range. There are two possible outcomes:
- If you split the range at the bottom of the list, end of the range at the bottom will be changed from ∞ to the start value + 1. Then the system will add a new item that starts at the end value calculated for the item above and end at ∞.
- If you split any other range, the system will calculate a value half way between the end value of the item you're splitting and the end value of the row below. The new end value of the split row will become the calculated value. The system will then add a new item below split one. The new value will start at the calculated value, and end at the start value of the row below.
Click on the Remove  icon to delete a row. There are two possible outcomes.
- If you delete the bottom row, the row disappears and the row above has its end value set to ∞.
- If you delete any other row, the row disappears and the row that was below has its start value set to the start value of the row that was deleted.
Click on the end value of a range to edit it. You'll get a popup that looks like this:
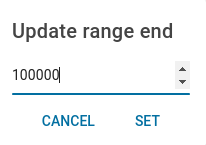
If you change the value and click Set, the system will set both the end value of the range you've edited and the start value of the item below.
When determining which colour to use, the system will consider a value "in the range" if the value is greater than the start value and less than or equal to the end value. So the end of one range should be the same as the start of the following range. The system described above enforces this.
As with the category layer colours above, you can enable or disable specific ranges using the enable switch. If disabled, a range will not render on the map. The toggle in the Enabled header can also be used to toggle all layers on or off quickly.