Appearance
Understanding the dashboard
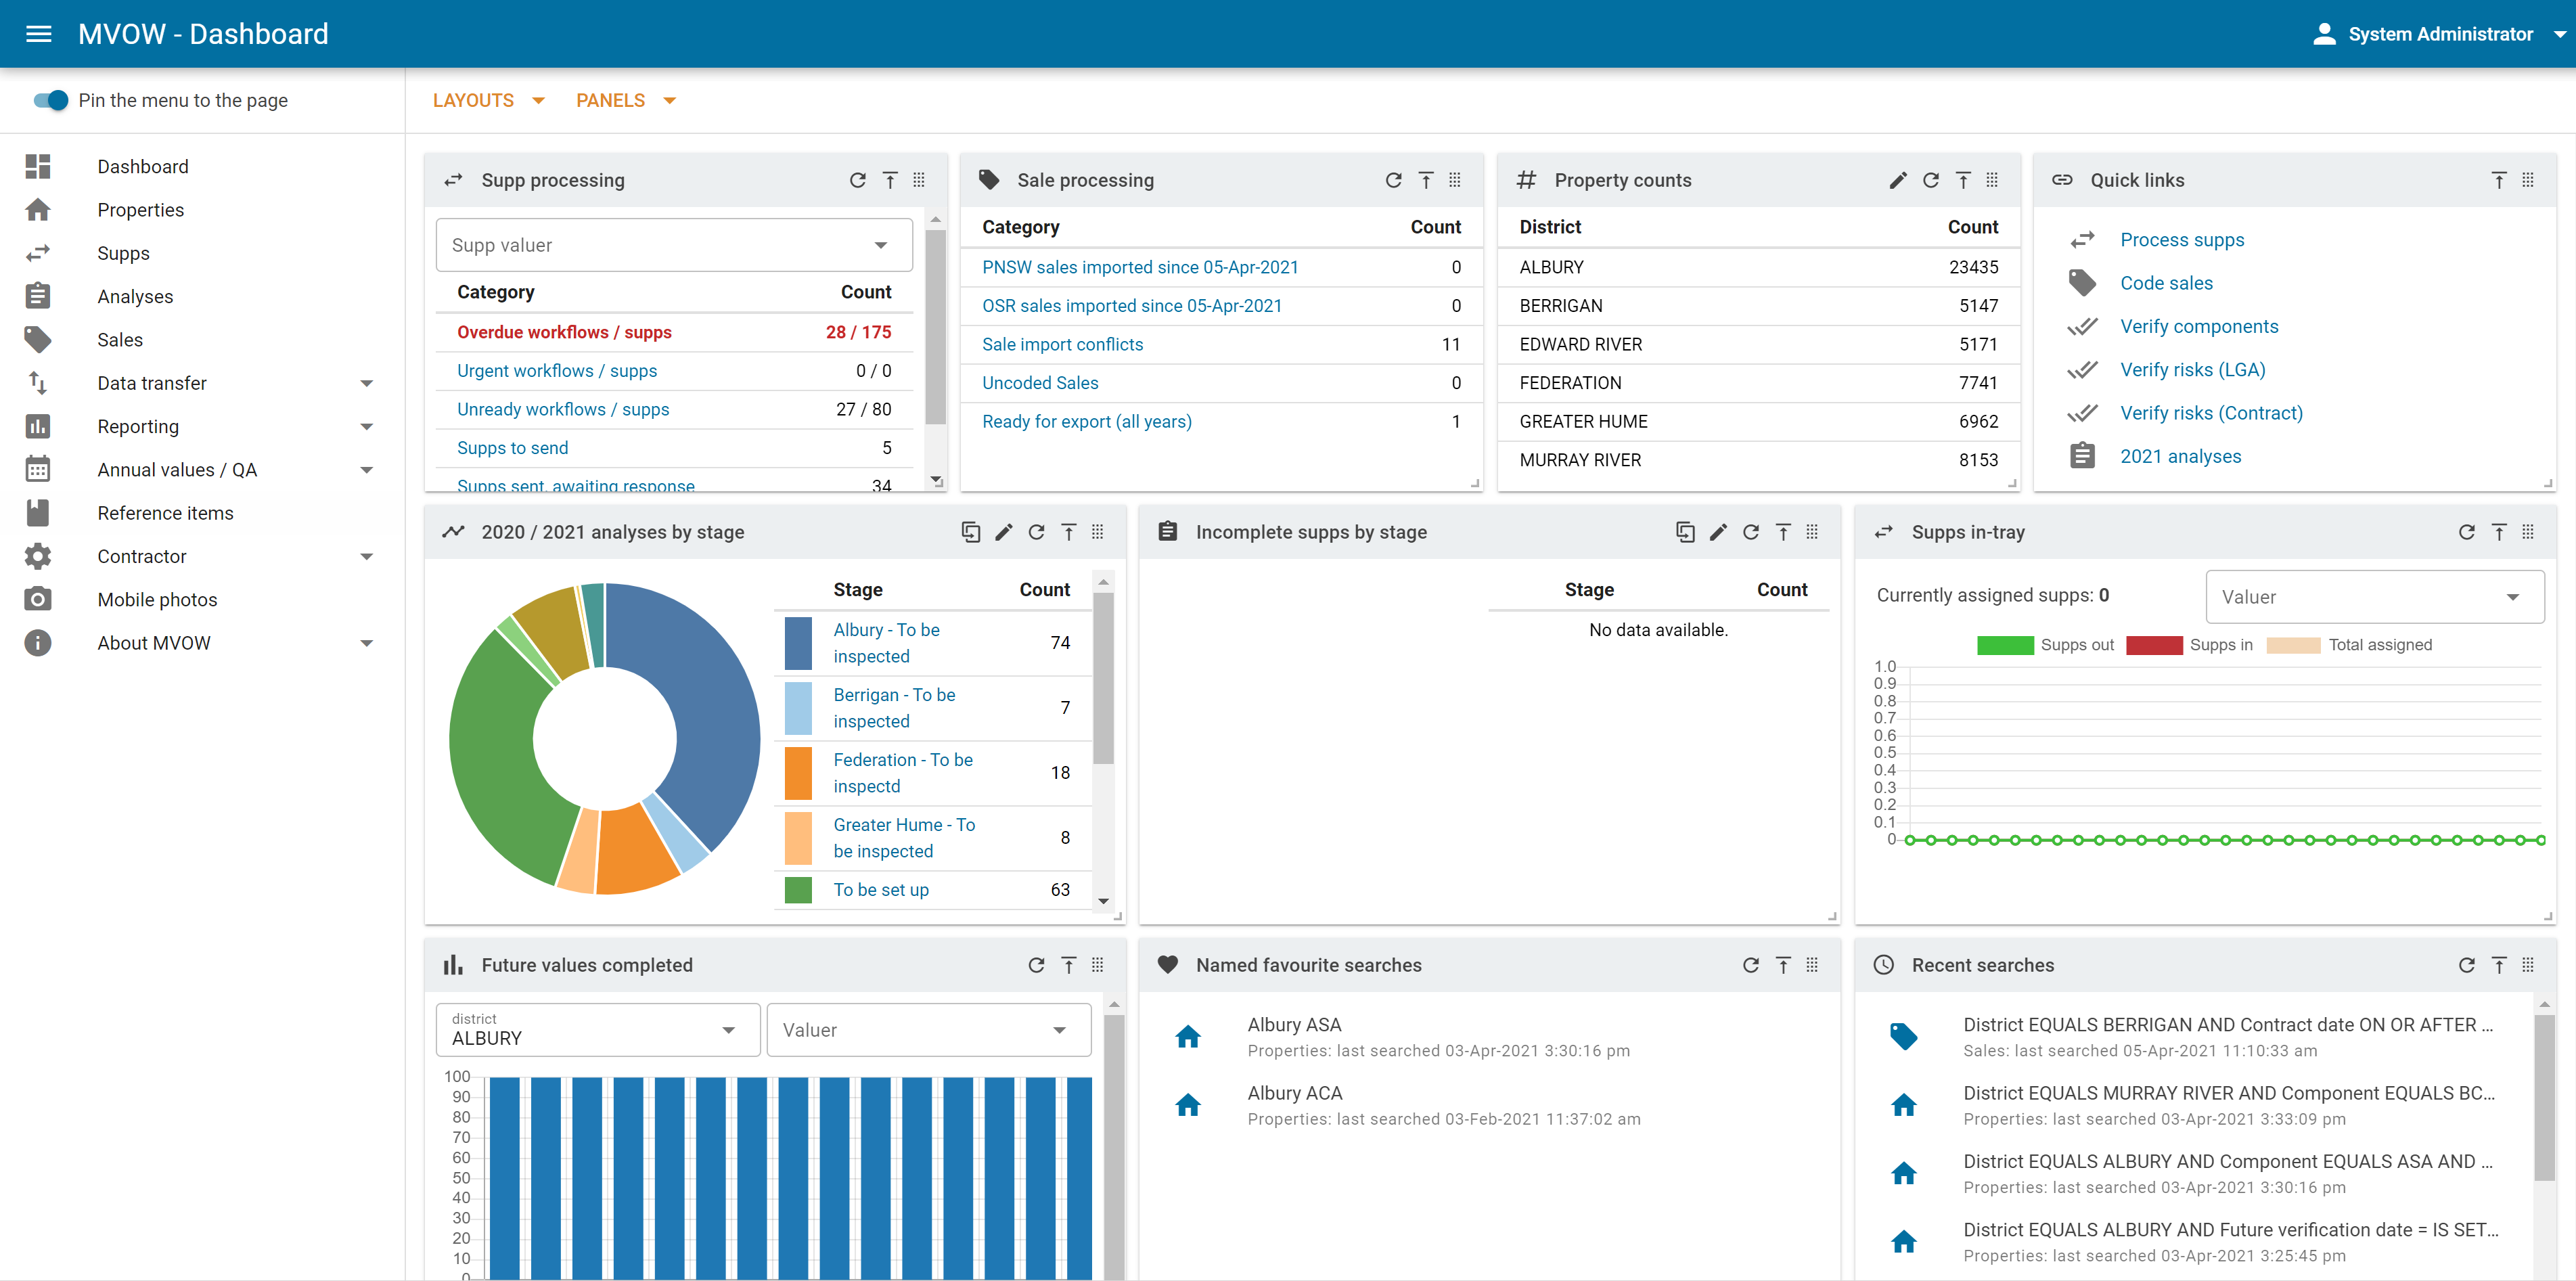
On logging into MVOW, the first page you see is the Dashboard. The Dashboard consists of a series of panels that provide a summary of the current data in the system.
As you get to know the various counts, charts and graphs displayed on the Dashboard, you will find them useful indicators as to the progress of your team.
Panel content
The contents of the panels are described in the Reference manual Dashboard page.
Working with panels
Dashboard panels can be:
- Moved using the Drag panel
 button
 - Placed at the top using the Top panel
 button
 - Expanded or contracted using the Resize
 handle (in the bottom-right corner of each panel).
You can show and hide panels by ticking and unticking items in the Panels menu.
Introducing panel layouts
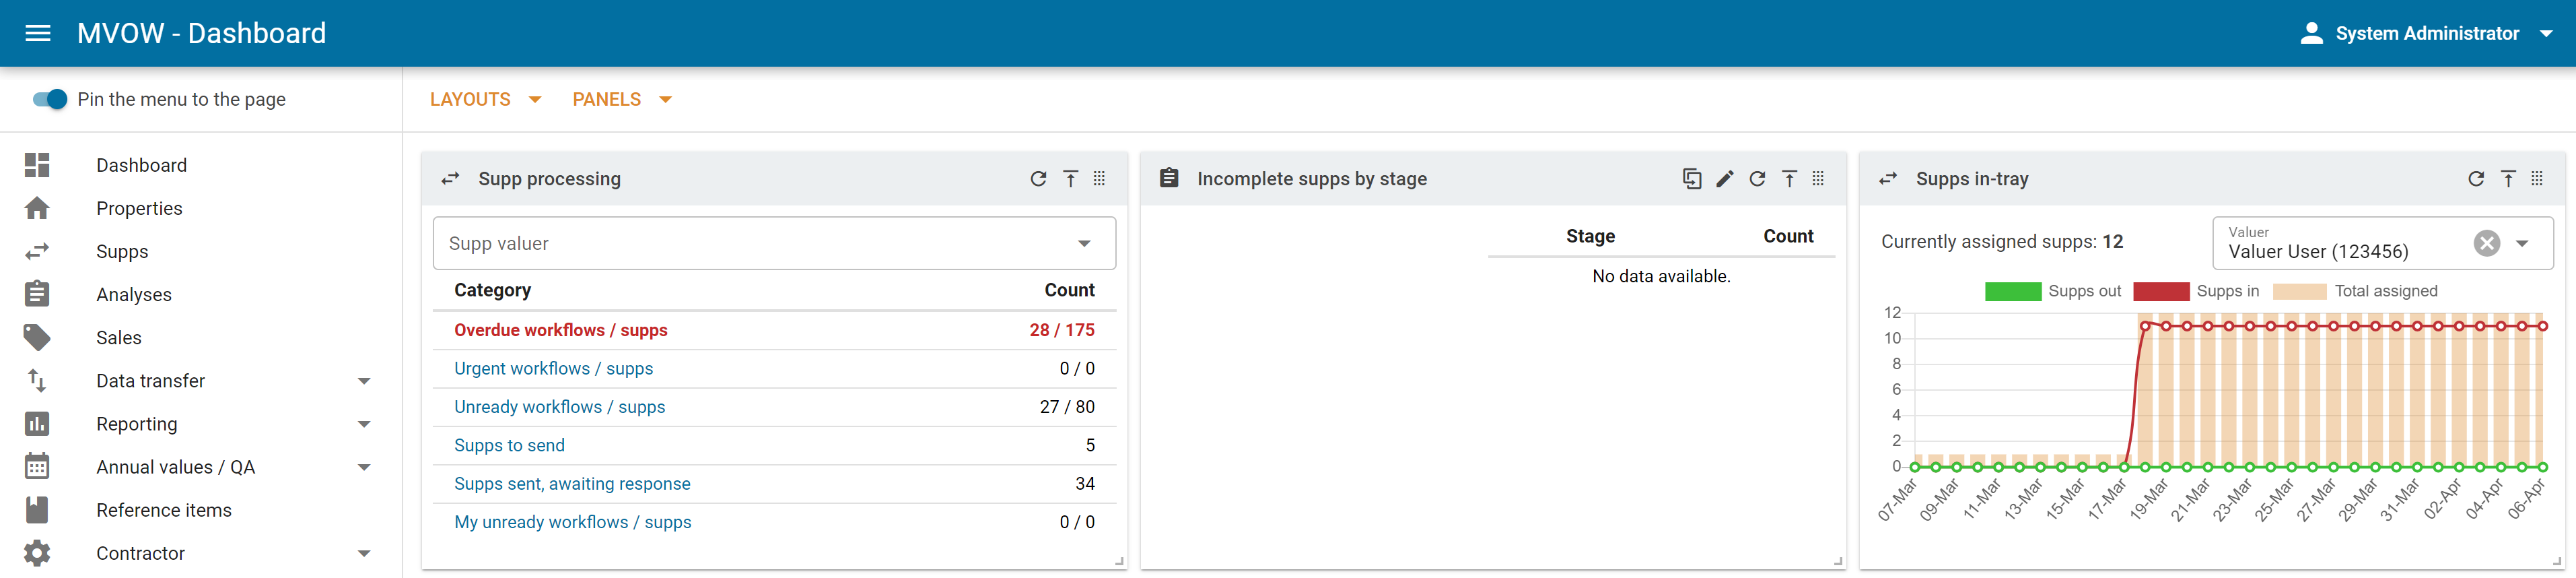
The panels can be moved, resized and organised into different layouts.
Example layouts
Default layout
Custom supps layout
To learn how to create and manage panel layouts, see Working with panels.